This week, I give you yet another useful-if-done-right chart, the Venn diagram.
Active Ingredients (What is a Venn Diagram?)
ICYMI, a Venn diagram shows overlapping categories or sets usually represented by circles.
Uses
These diagrams are great for showing the degree to which categories or sets overlap and what elements fall inside/outside of each set and each overlapping portion. The take home message is usually the shaded area where all of the circles intersect. So make that area easy to locate using color and labels. This example shows how an organization bridges the gap among three different types of organizations working on foreign policy.
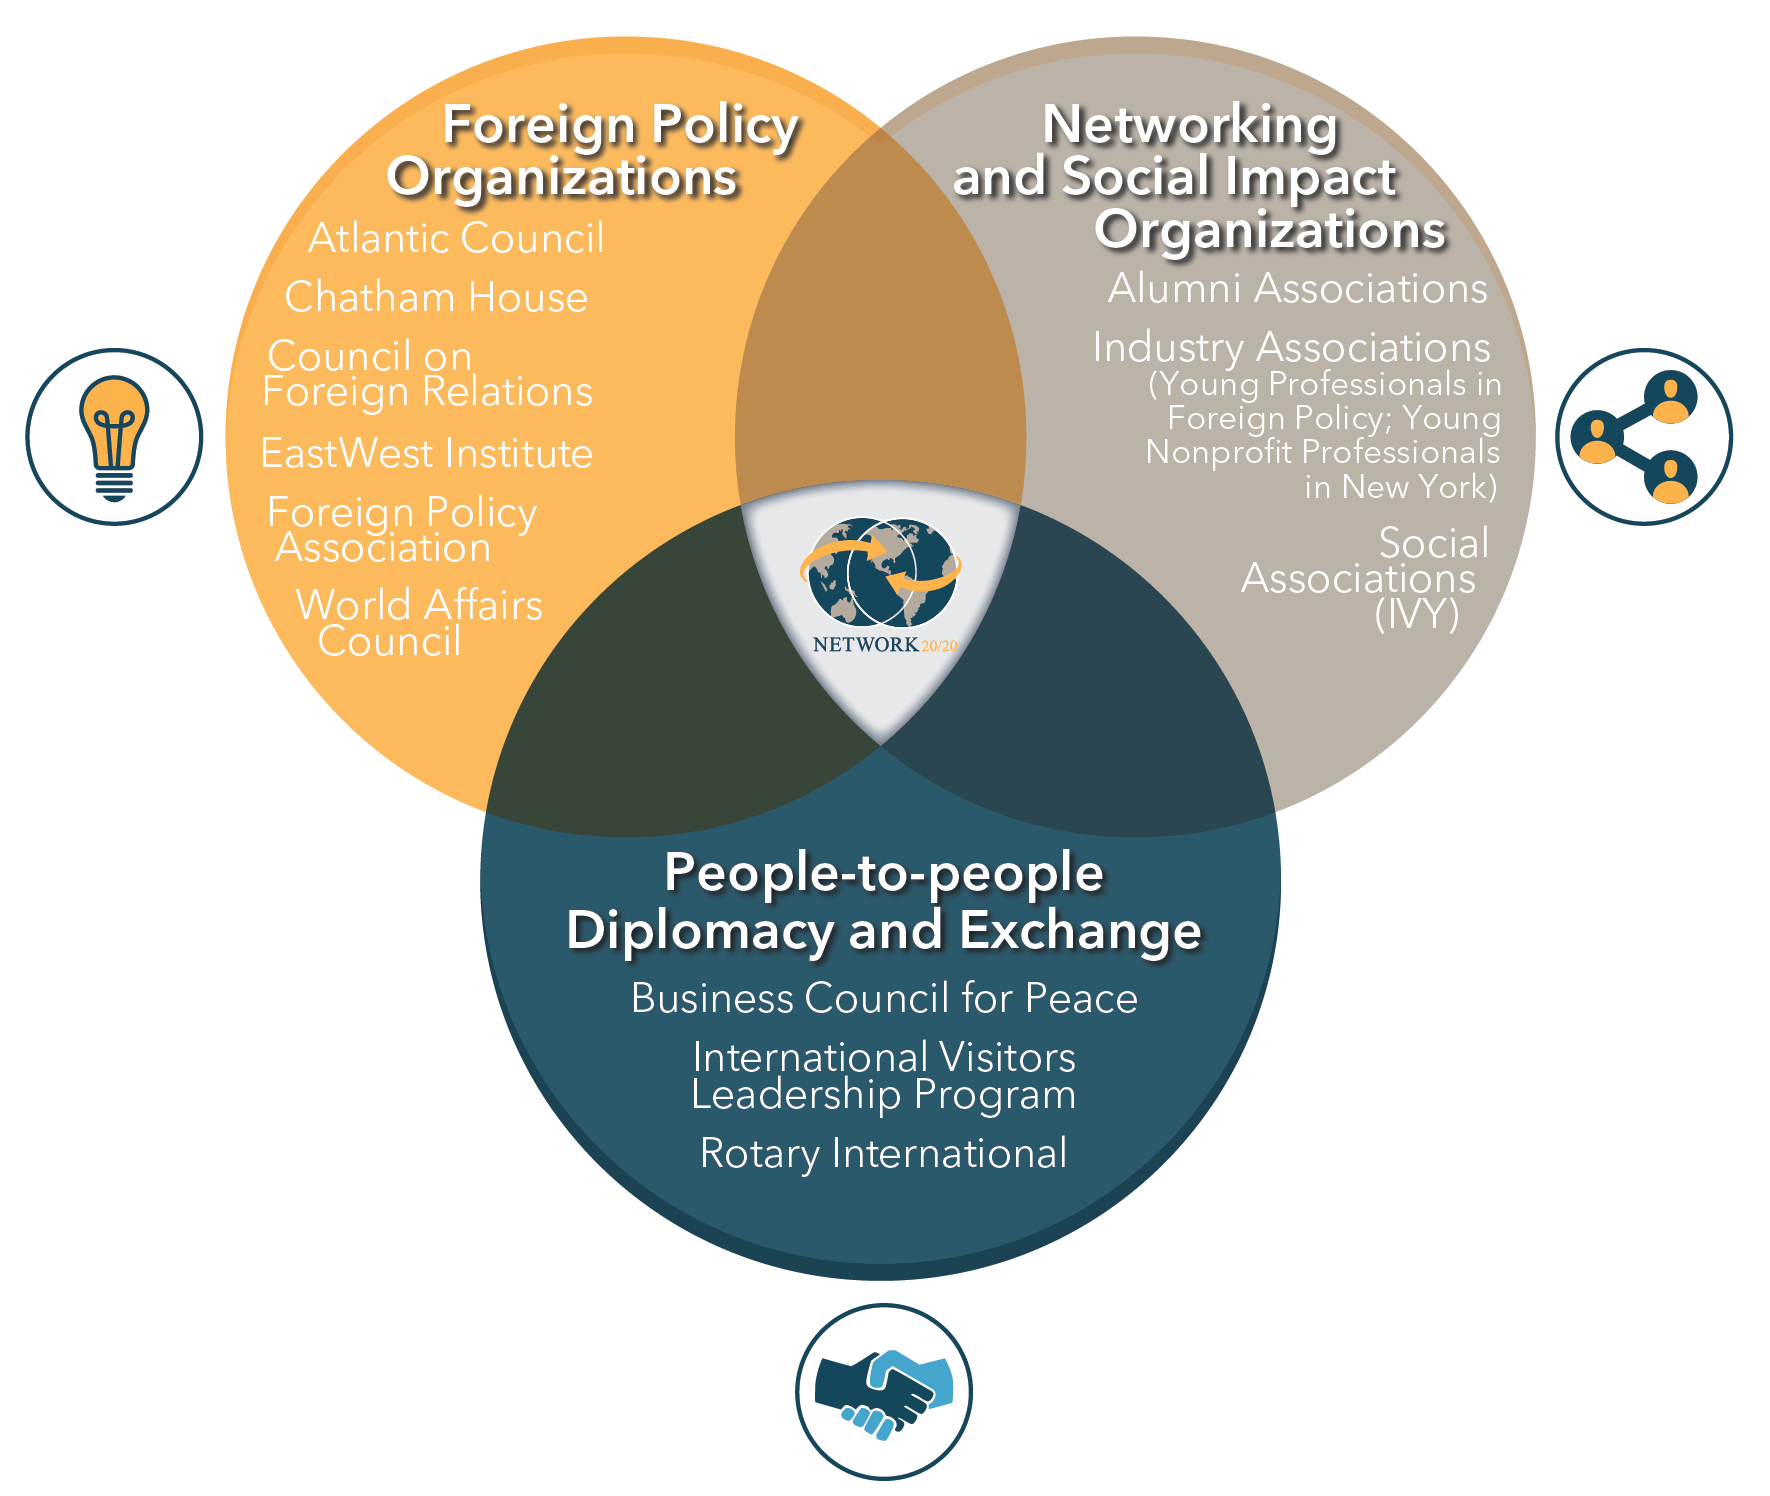
Source: Network 20/20
Warnings
For me, Venn-diagram-fatigue sets in early. I get tired of discerning the meaning of each overlapping area pretty quickly. So I’d suggest limiting the number of circles. And, more importantly, clearly labeling the sets.
Here’s one that I gave up on after about 15 seconds:

Source: @DanNeidle
On the other hand, this Venn diagram works even with four sets because the sets (orphaned, wealthy, sidekick, and masked) are clearly marked and the intersection labels are simple.

Source: gliffy.com
Fun Fact
English mathematician John Venn is credited with inventing the Venn diagram in the 1860s, and, according to Phil Plait, there are two kinds of people in the world . . .

Source: DiscoverMagazine.com
To see past data tips, including those about other chart types, click HERE.
Let’s talk about YOUR data!
Got the feeling that you and your colleagues would use your data more effectively if you could see it better? Data Viz for Nonprofits (DVN) can help you get the ball rolling with an interactive data dashboard and beautiful charts, maps, and graphs for your next presentation, report, proposal, or webpage. Through a short-term consultation, we can help you to clarify the questions you want to answer and goals you want to track. DVN then visualizes your data to address those questions and track those goals.