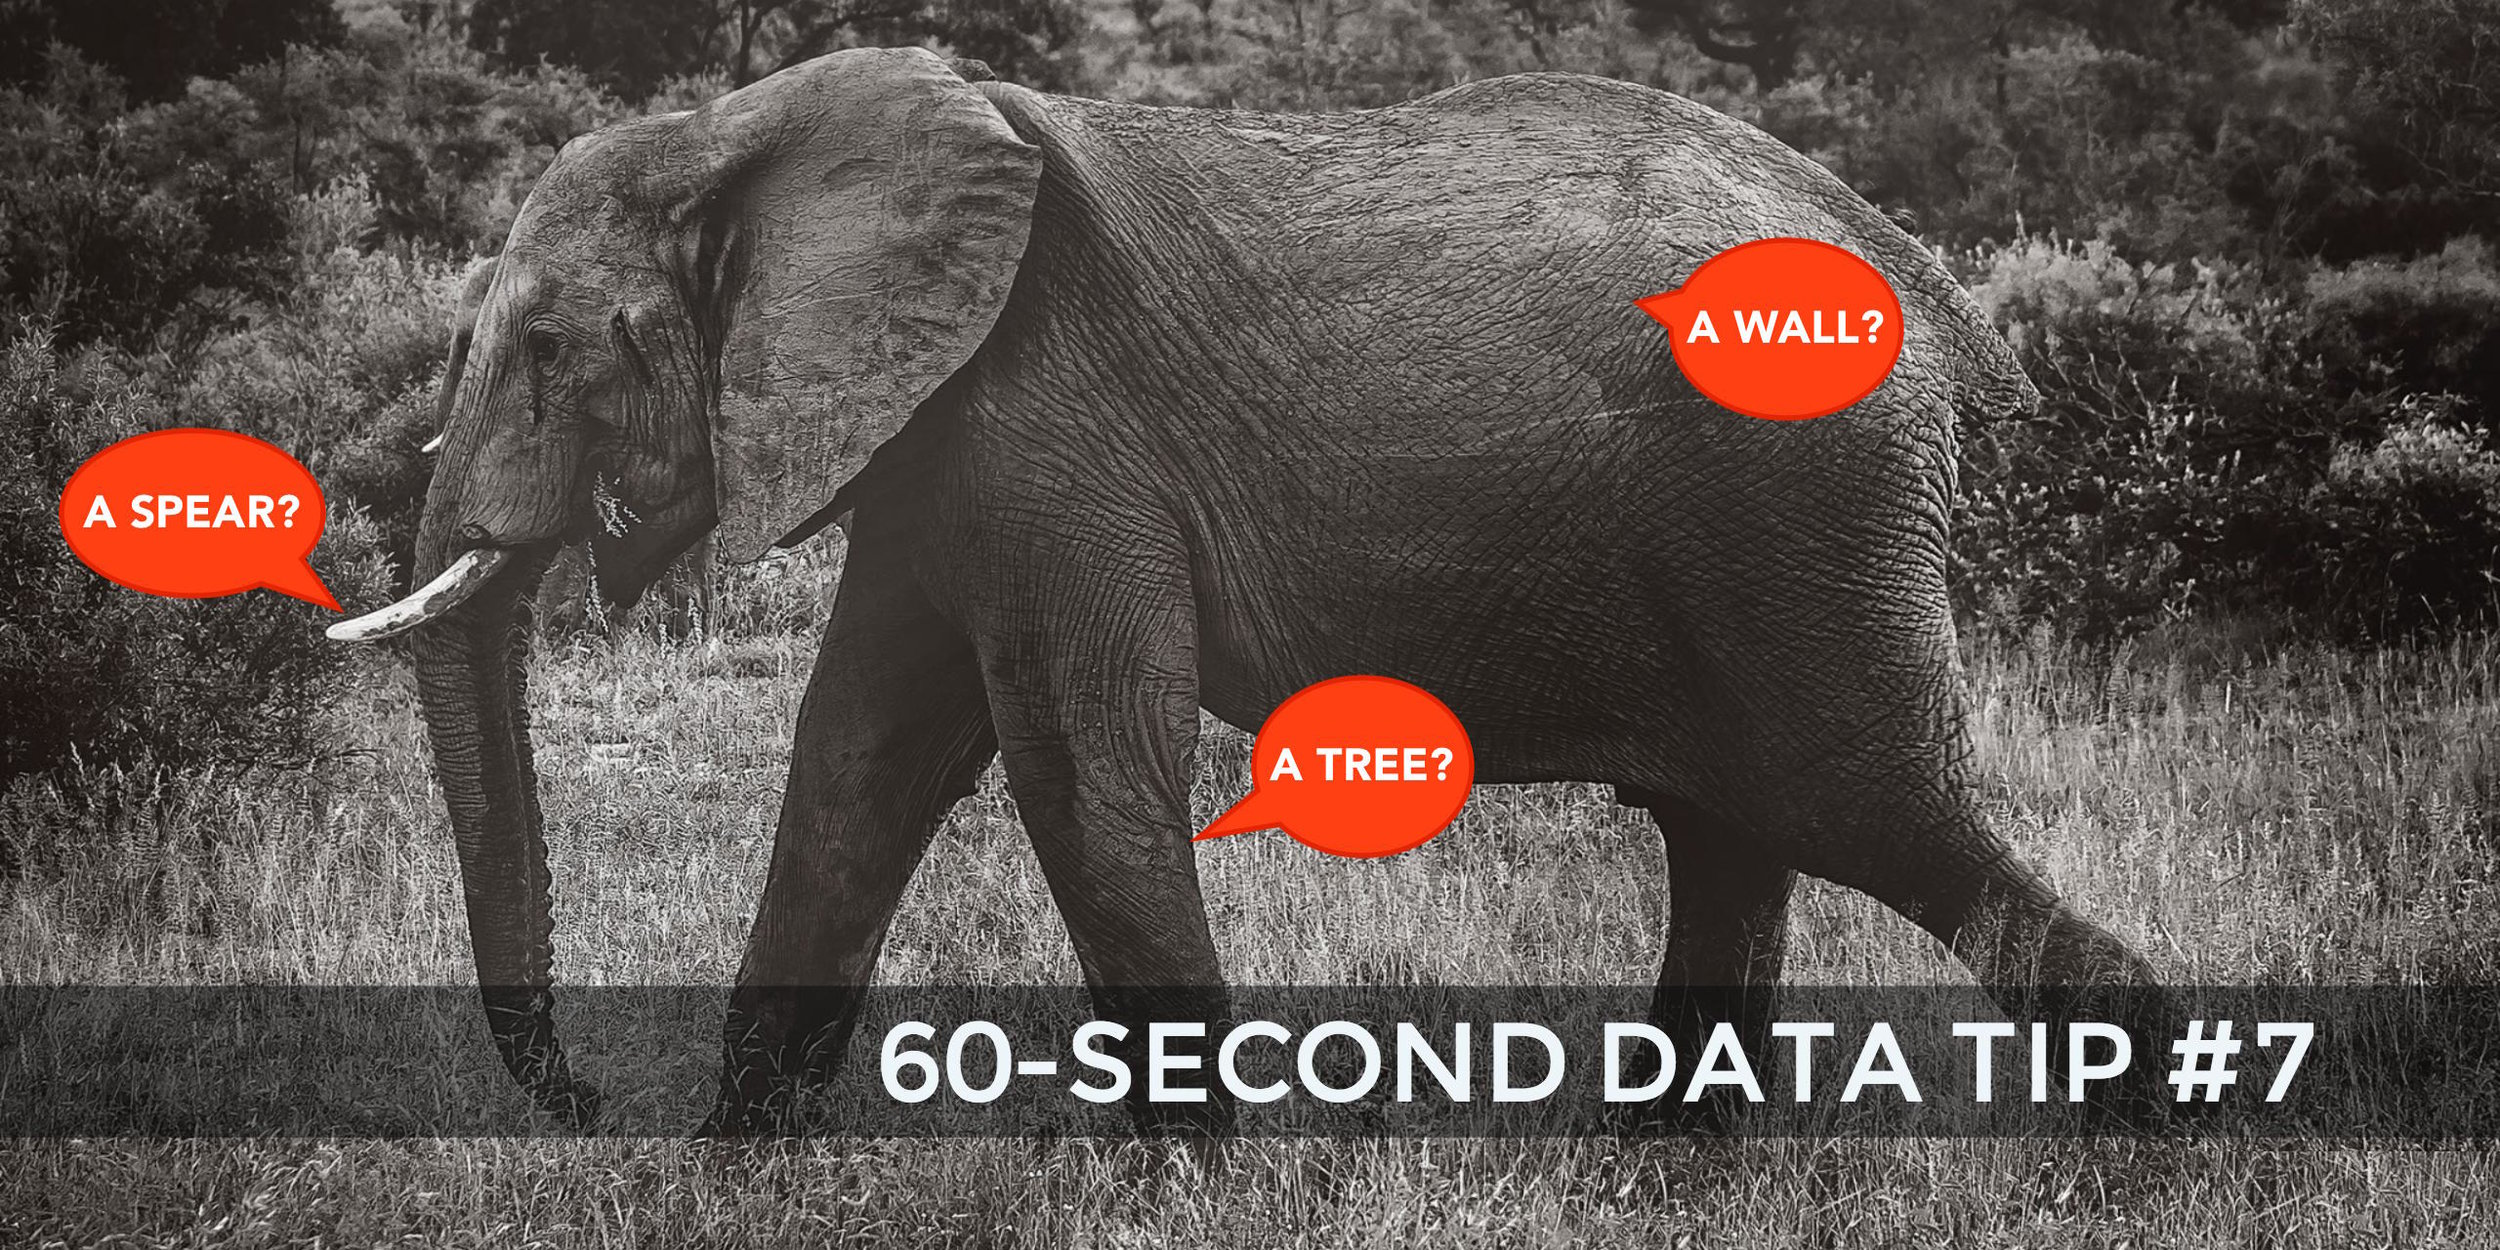
In an ancient Indian parable, a group of blind men encounter an elephant for the first time. Each man feels a different part of the animal and reaches his own conclusions. One feels a tusk and proclaims it a spear. Another feels a leg and decides it’s a tree trunk. The message? Collect more evidence and take a wider view. This is a good message for nonprofits. Notice a 3-month downward trend in participation in one of your programs? Zoom out and see if the trend holds over longer periods of time. If not, is there a cyclical pattern? For example, when looking at the trend over the past 5 years, does participation increase during certain months and decrease in others? Also, zoom in and see if the trend holds for subgroups. Is there a downward trend for boys in your program but an upward trend for girls? Do those in certain age groups have differing trends? Zoom out and zoom in to clearly understand the whole story.
See other data tips in this series for more information on how to effectively visualize and make good use of your organization's data.
Photo by jinsu Park on Unsplash