
We visualize data to take advantage of our visual superpowers. And when doing so, we should keep in mind how our mind works. We humans are great at detecting patterns, even when none exists (think conspiracy theories). From an evolutionary perspective, pattern recognition has helped us to understand what we see and make predictions that help us survive and reproduce.
Order is a particular type of pattern. It is the arrangement of people or things in relation to each other according to a particular sequence. So when there is an order to our data, we should show it. Our pattern-seeking minds will thank us for delivering up a real pattern and making it so easy for us to see.
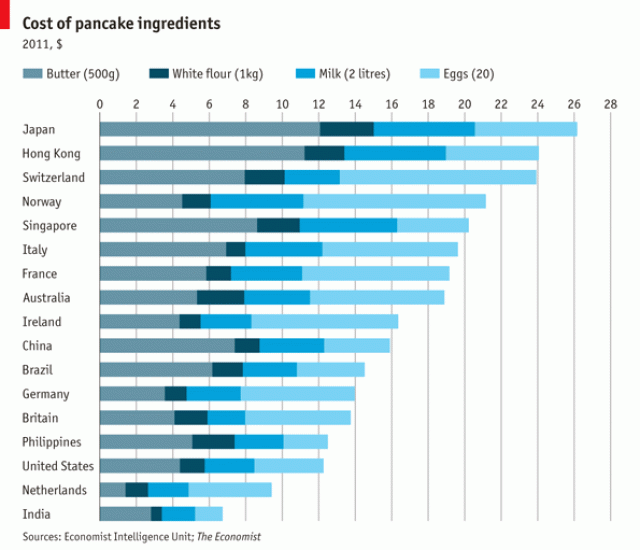
For example, arrange bars on a bar charts in descending order so that viewers can easily pick out the top/bottom or the most/least. In this visualization from The Economist, we can easily see that Japan is the most expensive place to make pancakes (assuming you are buying all of your ingredients there.) It also gives you a sense of what is driving the difference in cost of pancake ingredients: butter in Japan, eggs in Switzerland.
See other data tips in this series for more information on how to effectively visualize and make good use of your organization's data.
Camel by Tatiana Belkina from the Noun Project